

Here’s a mixed mode display showing the time domain trace of a 1.6KHz carrier modulated by 480Hz and it’s spectrum. The time domain On Screen Measurement tool is deployed and is measuring the peak to peak signal level. The trace has also been expanded with a pinch/expand action to make the waveform’s shape more visible.
Because the display is expanded it’s equivalent sweep rate (displayed in orange) is shown to the right of set sweep rate (in white). The Scrubber View is deployed because the memory depth is deeper than necessary for the sweep rate chosen and this produces a trace longer than the visible screen. The deeper memory depth is actually selected to produce sharper peaks in the FFT spectrum due to larger sample size.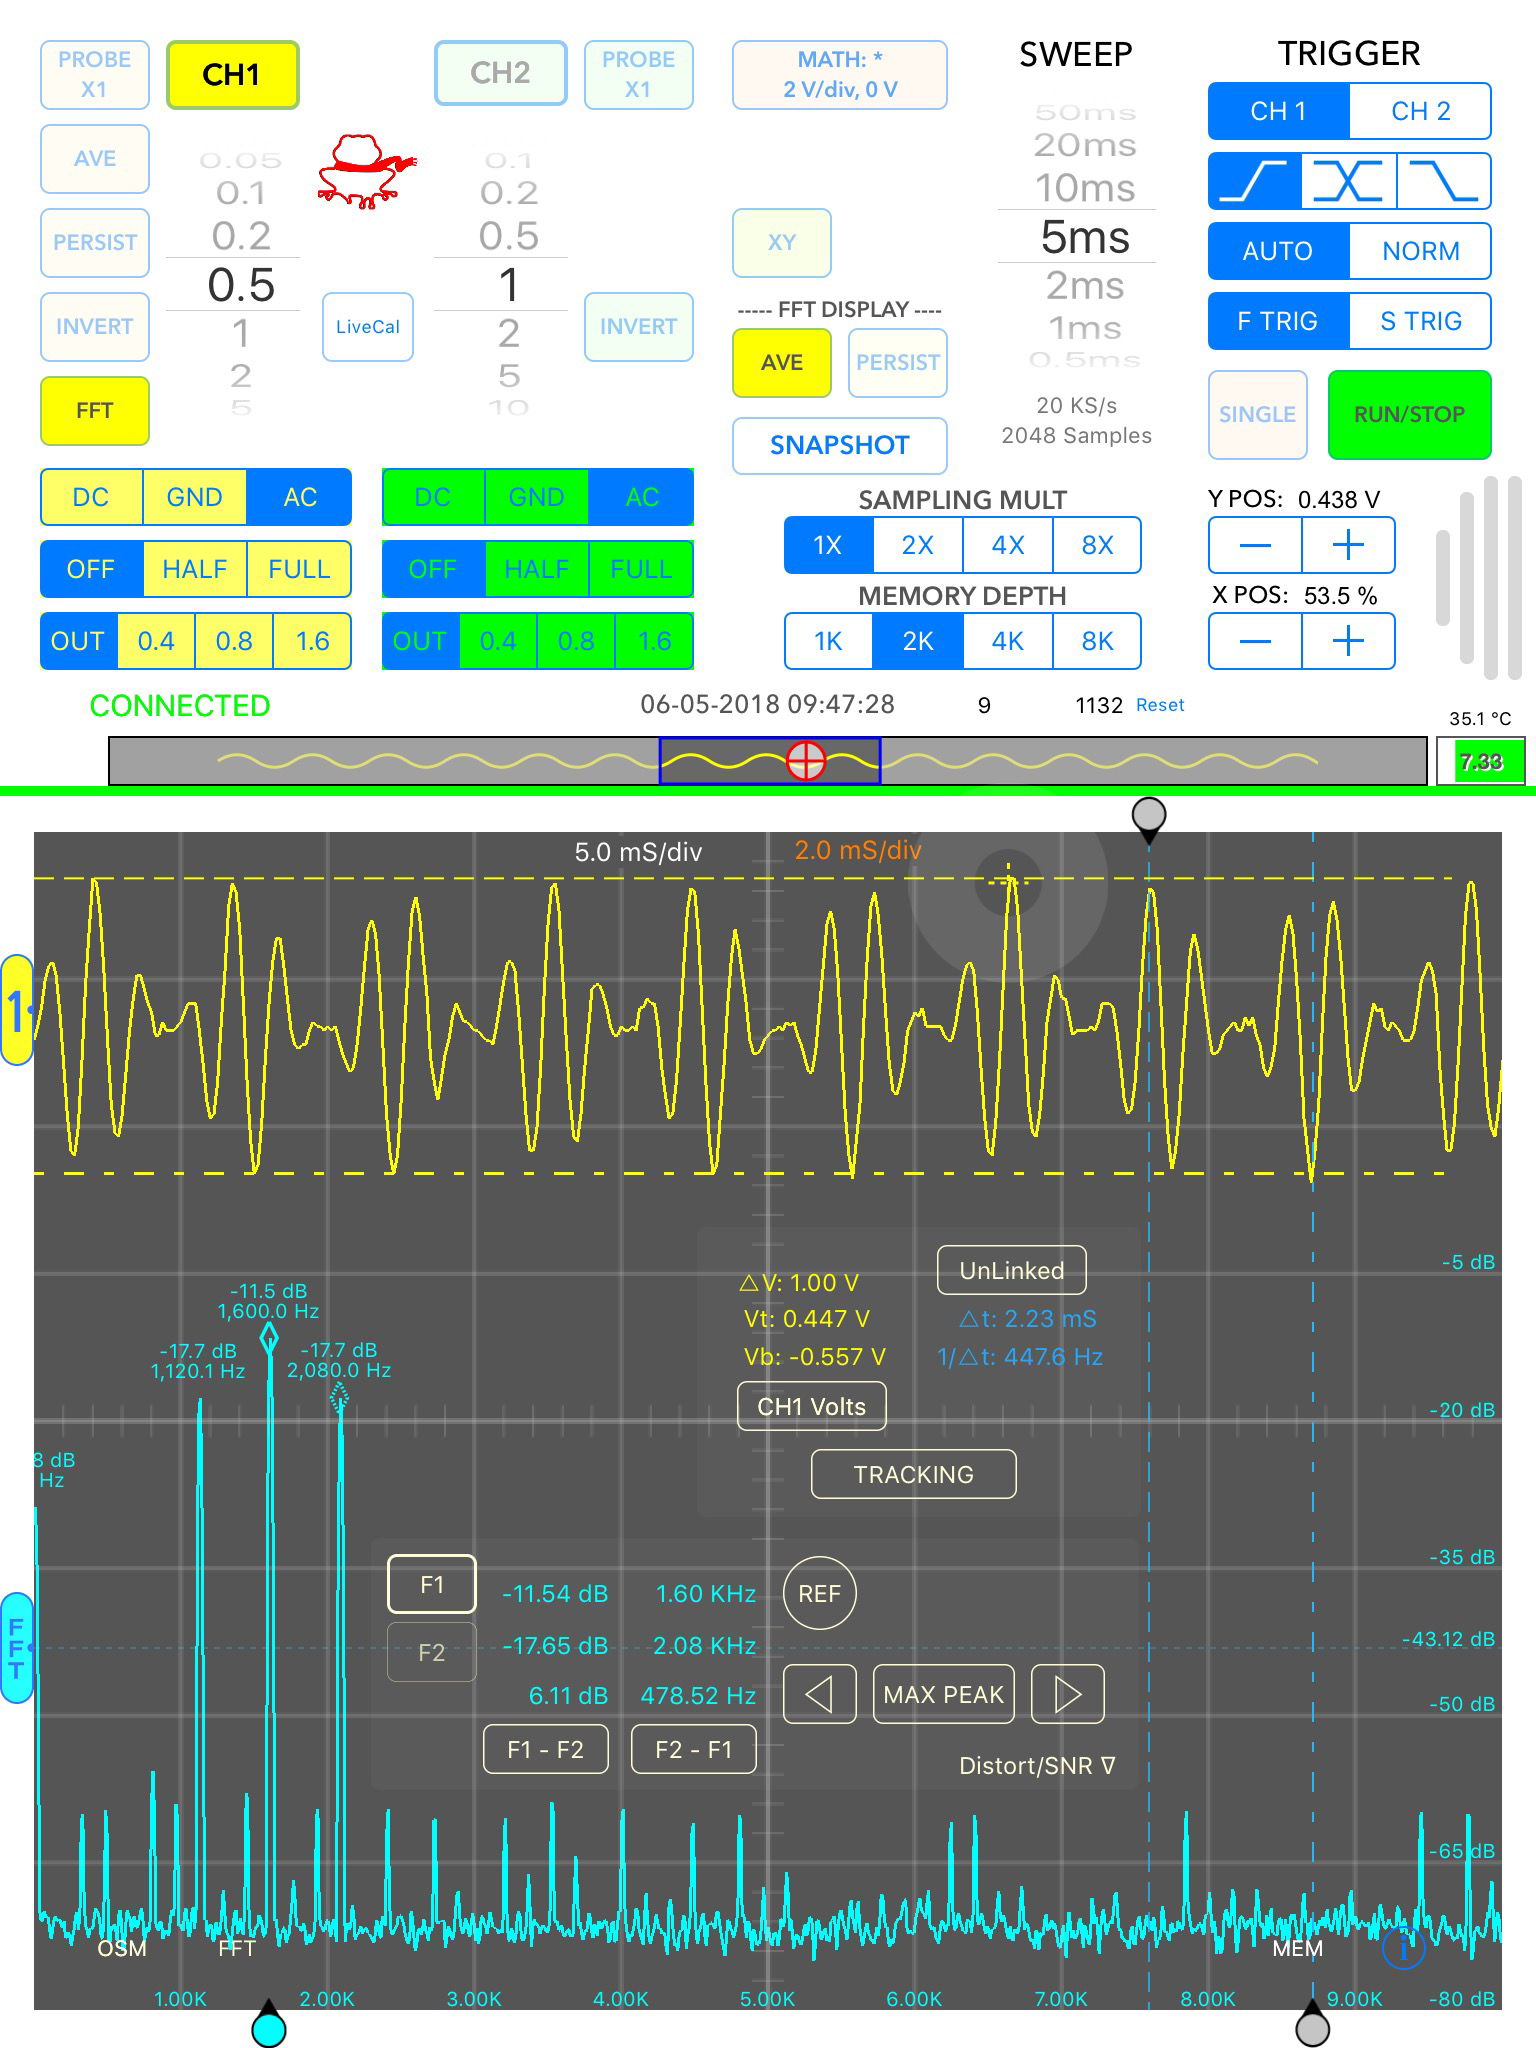
Even without the deeper memory the Scrubber View would be deployed since the expansion of the time domain trace would have made the trace longer than the visible screen and that deploys the Scrubber View. The measurement panel was dragged to an unused area of the scope display and graticule intensity was lowered to reduce screen clutter.
The FFT peak labels are automatically created and any peaks above the FFT reference line (dashed) are displayed. Peak labels can set to display either dB or millivolts when using a log scale. A linear scale can also be selected. The FFT On Screen Measurement tool is showing only the Markers tool (Distortion/Noise tool is rolled up). Its markers are positioned on the carrier and upper sideband peaks and the tool’s readouts show the peaks’ individual magnitudes, frequencies and and the difference between them. Markers can be positioned manually by sliding the bottom pointer or by using the Max Peak and next peak left/right buttons. Markers can be nudged one data point at a time by tapping on either side of the pointer for exact positioning. The measurements panel was dragged to a convenient position on the scope display.
Notice that all the important operational parameter like sampling frequency, sample size, input sensitivity, trigger position and coupling are constantly displayed and available for reference purposes on a screen shot like this along with a timestamp display to help differentiate different screen shots.